SaaS Event Merchandise Logistics Dashboard
Summary
Streamlining tour merchandise operations for teams on the road
Project
Live Event Tour Merchandise Startup
Timeline
2024-2025
Services
UX/UI Designer

Streamlining tour merchandise operations for teams on the road
Live Event Tour Merchandise Startup
2024-2025
UX/UI Designer
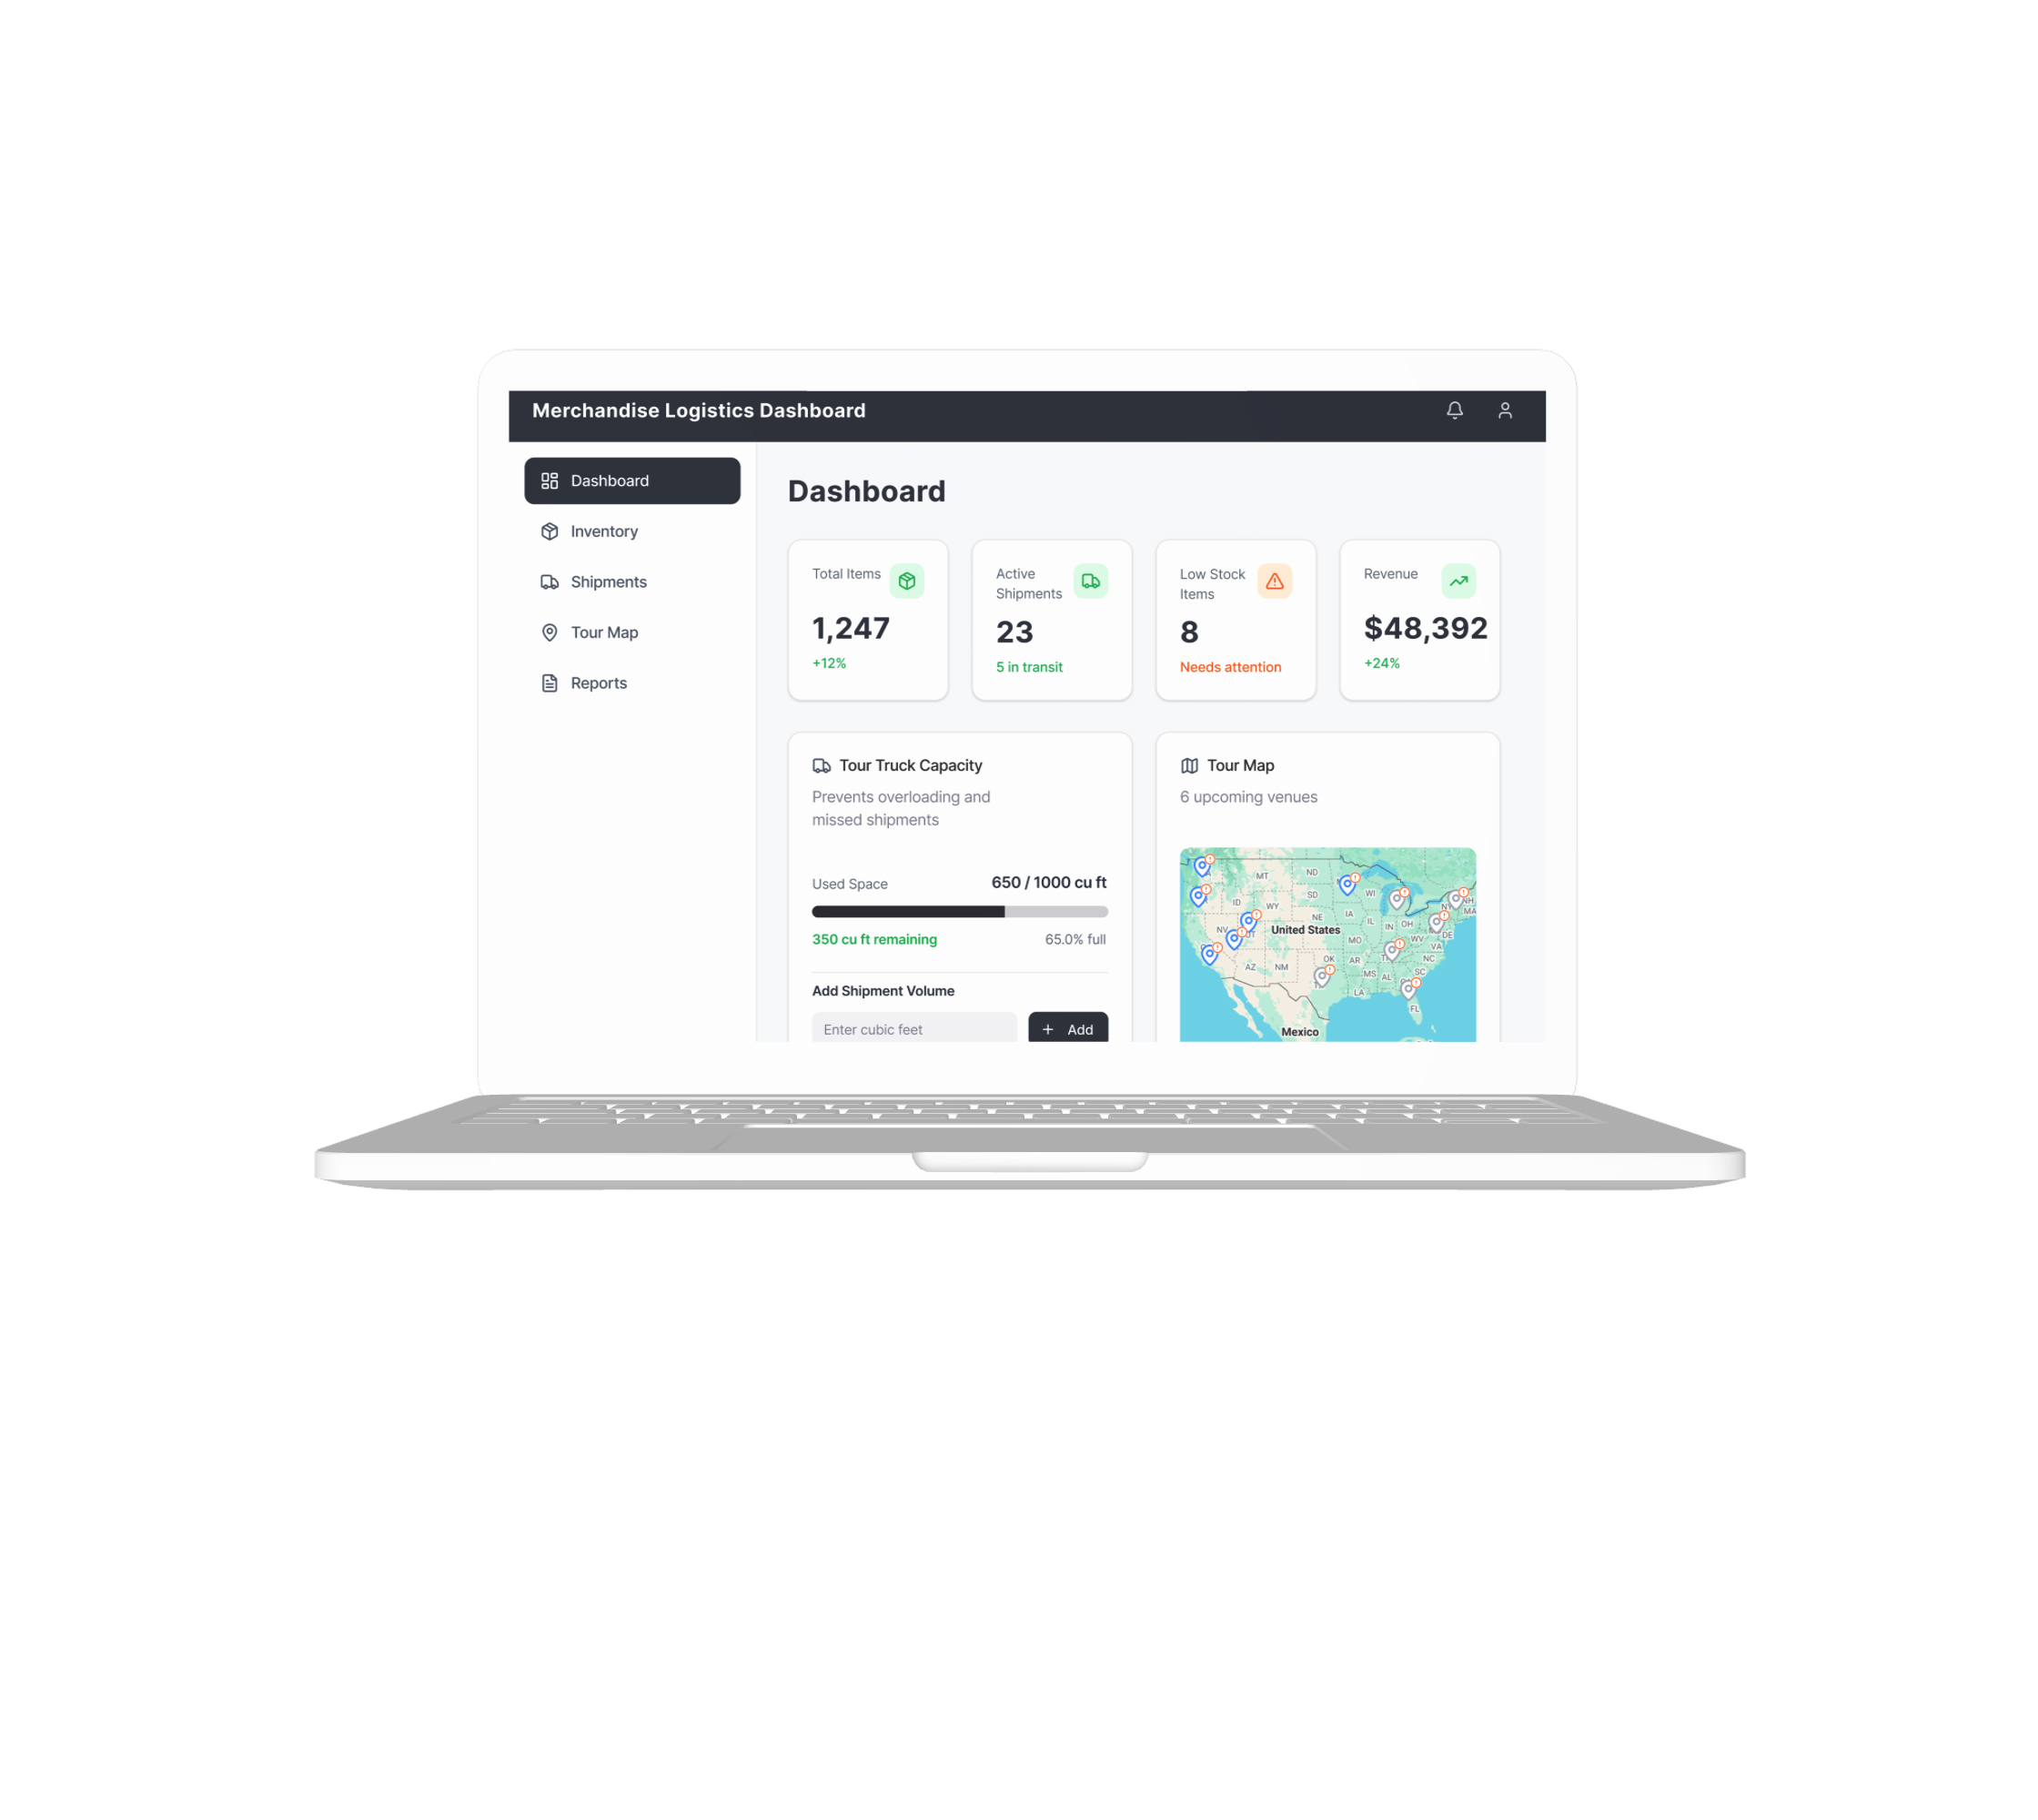
Tour merch teams operate in fast-paced, constantly changing environments—managing inventory, shipments, and sales across multiple cities with little room for error. I designed a centralized dashboard for Virch Merch to simplify these workflows and support faster, more informed decision-making on tour.
Tour merch teams operate in fast-paced, constantly changing environments—managing inventory, shipments, and sales across multiple cities with little room for error. I designed a centralized dashboard for Virch Merch to simplify these workflows and support faster, more informed decision-making on tour.
Through interviews with merch managers and industry research, I uncovered key challenges:
Design a dashboard that centralizes operations, increases visibility, and helps merch teams make quick, confident decisions while on tour.
UX/UI Designer
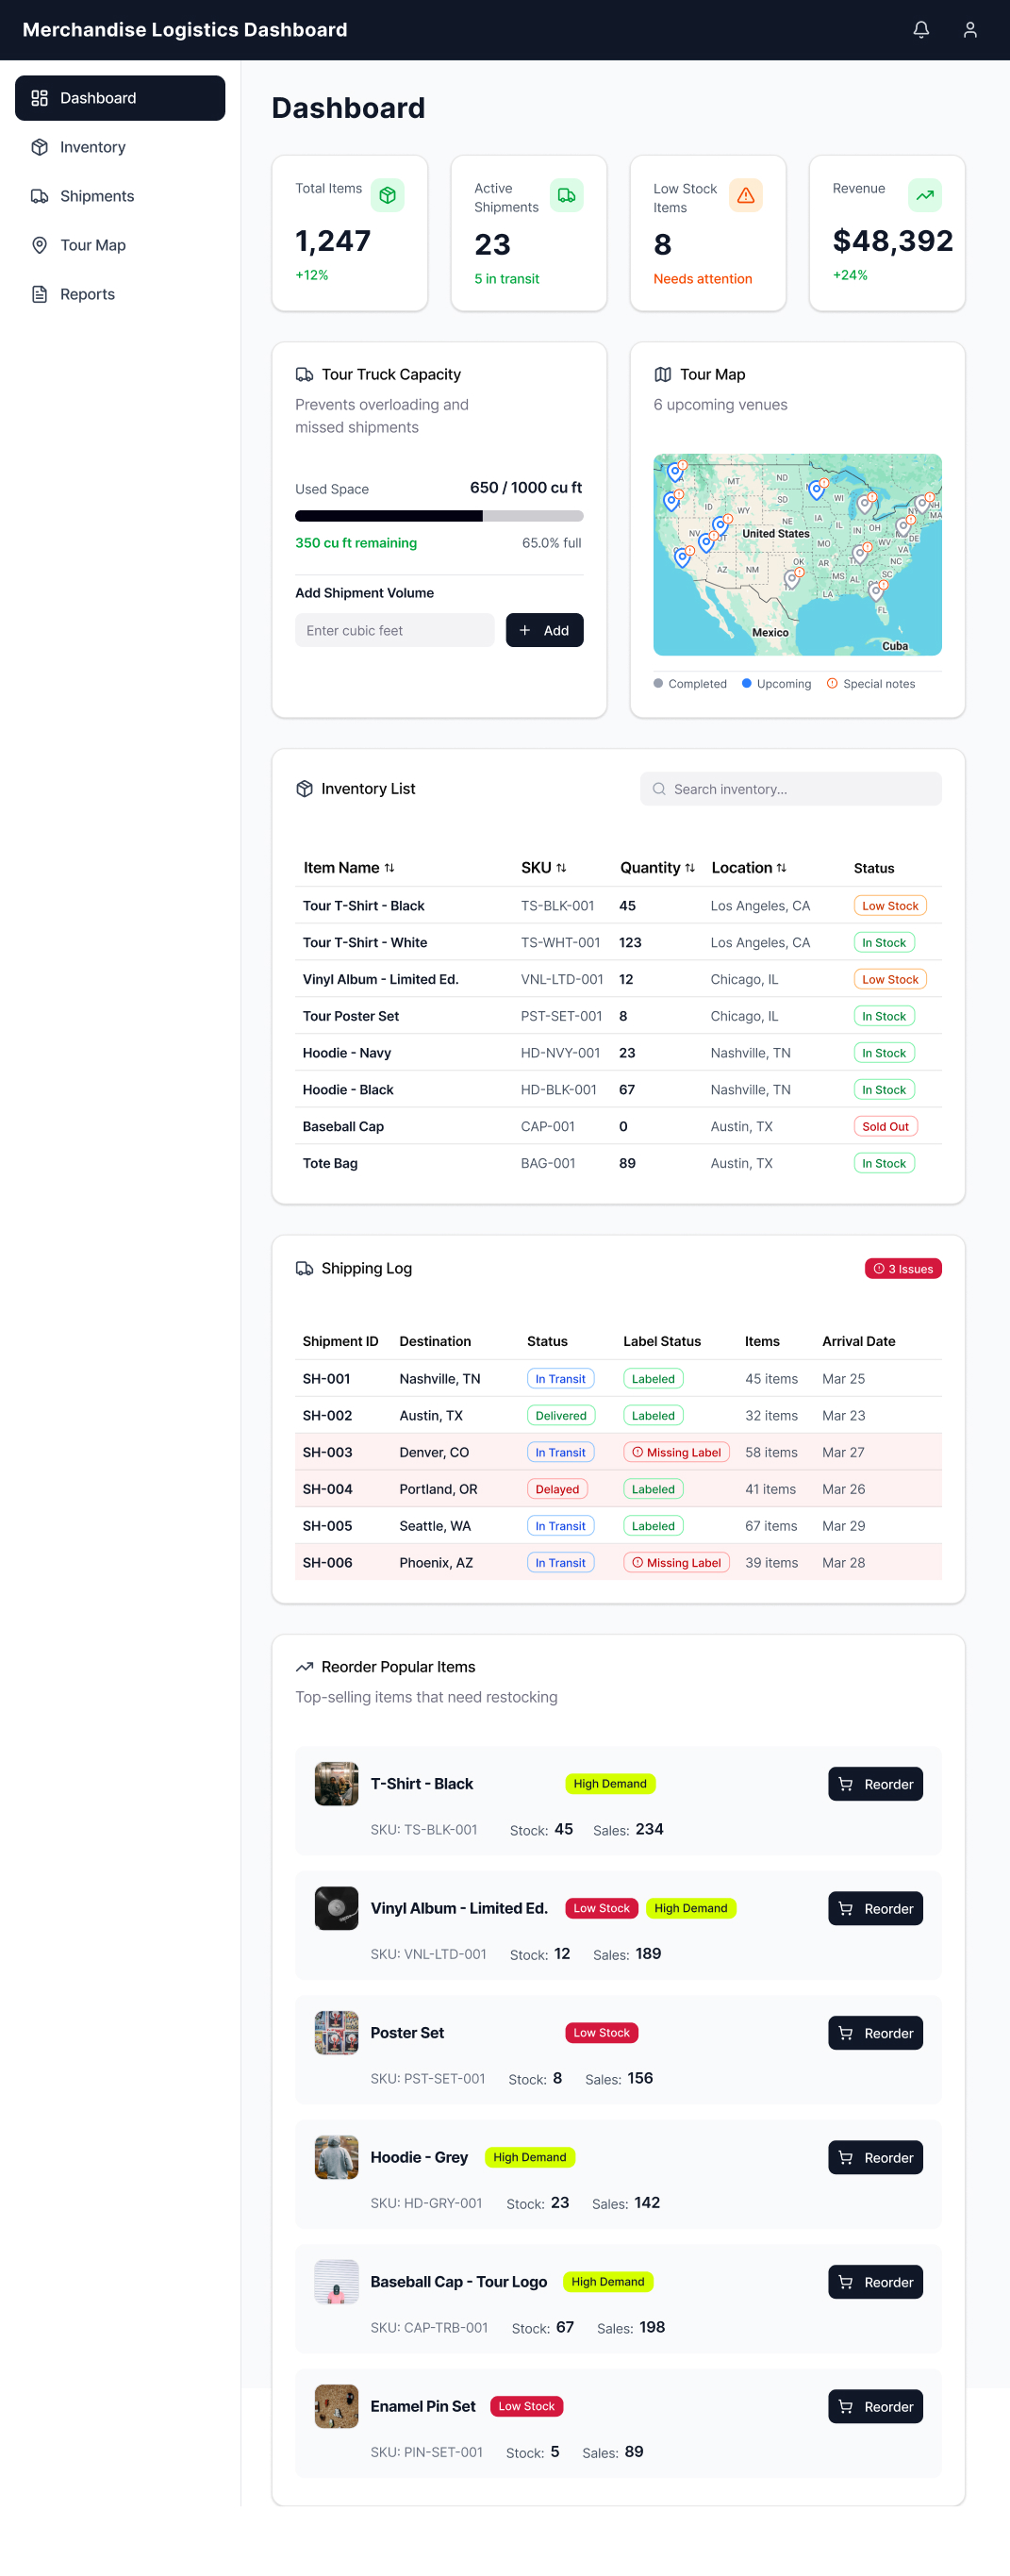
I designed a modular dashboard that brings together key logistics and decision-making tools in one place:
Centralized Overview
A single source of truth for inventory, shipments, and sales—reducing reliance on memory and disconnected tools.
Tour Truck Capacity Calculator
Helps teams plan shipments based on available truck space, preventing overloading and missed inventory.
Inventory Tracking
Location-based inventory visibility with clear stock statuses to prevent sellouts or overstocking.
Shipping Log
Organized shipment tracking with visibility into delays, labeling issues, and delivery timing.
Reorder Recommendations
Highlights high-performing, low-stock items to support faster restocking decisions.
Tour Map with Venue Context
Interactive map with venue-specific notes (e.g., space constraints, selling restrictions), helping teams prepare ahead of each stop.
The dashboard concept replaces fragmented workflows with a centralized, intuitive system—helping merch teams stay organized, adapt quickly, and operate more efficiently on the road.
This project strengthened my ability to translate messy, human-driven workflows into structured systems—while maintaining the flexibility needed for real-world use.
.png)
